SaaS
ReplayTrader
A browser-based flight simulator for traders: replay real historical price action, trade it as if you were live, and analyse your edge, built to be faster and more capable than the incumbent tools.
- Type
- Full-stack SaaS web app (freemium, subscription-based)
- Status
- Live in production
- Role
- Solo design + full-stack engineering
// what it does
ReplayTrader recreates the experience of live trading using real historical market data, without any money at risk. It's aimed at futures and forex prop-firm traders practising discretionary strategies (ORB, ICT concepts, price action, SMC).
Replay engine
Load any trading day for 20+ instruments and step through it candle by candle. Play, pause, rewind, fast-forward, and scrub, with speeds from 0.5× to 50×.
Realistic simulated trading
Market, limit, and stop orders; stop loss / take profit defined in pips, price, or dollar risk; trailing stops; automatic position sizing from a risk percentage; and simulated spread, commission, and slippage for true-to-life fills.
Institutional-grade charting
Built on TradingView Lightweight Charts: four chart types, seven technical indicators, eleven drawing tools, volume profile, custom indicators, custom timeframes, DST-aware session markers, and a timezone selector.
Trade journal & analytics
Every trade is logged, tagged, rated, and annotated, then fed into a comprehensive analytics dashboard: equity curve, drawdown analysis, win-rate and expectancy stats, time-of-day heatmaps, a contribution-style calendar, strategy breakdowns, Monte Carlo projections, and MFE/MAE risk scatter plots.
Prop-firm challenge simulator
Practise against configurable funded-account rules (profit target, max drawdown, daily loss limit) with a live progress dashboard.
Monetised
Freemium model with Free, Pro (£19/mo), and Elite (£39/mo) tiers, gated across instruments, timeframes, sessions, persistence, and advanced analytics.
// screenshots
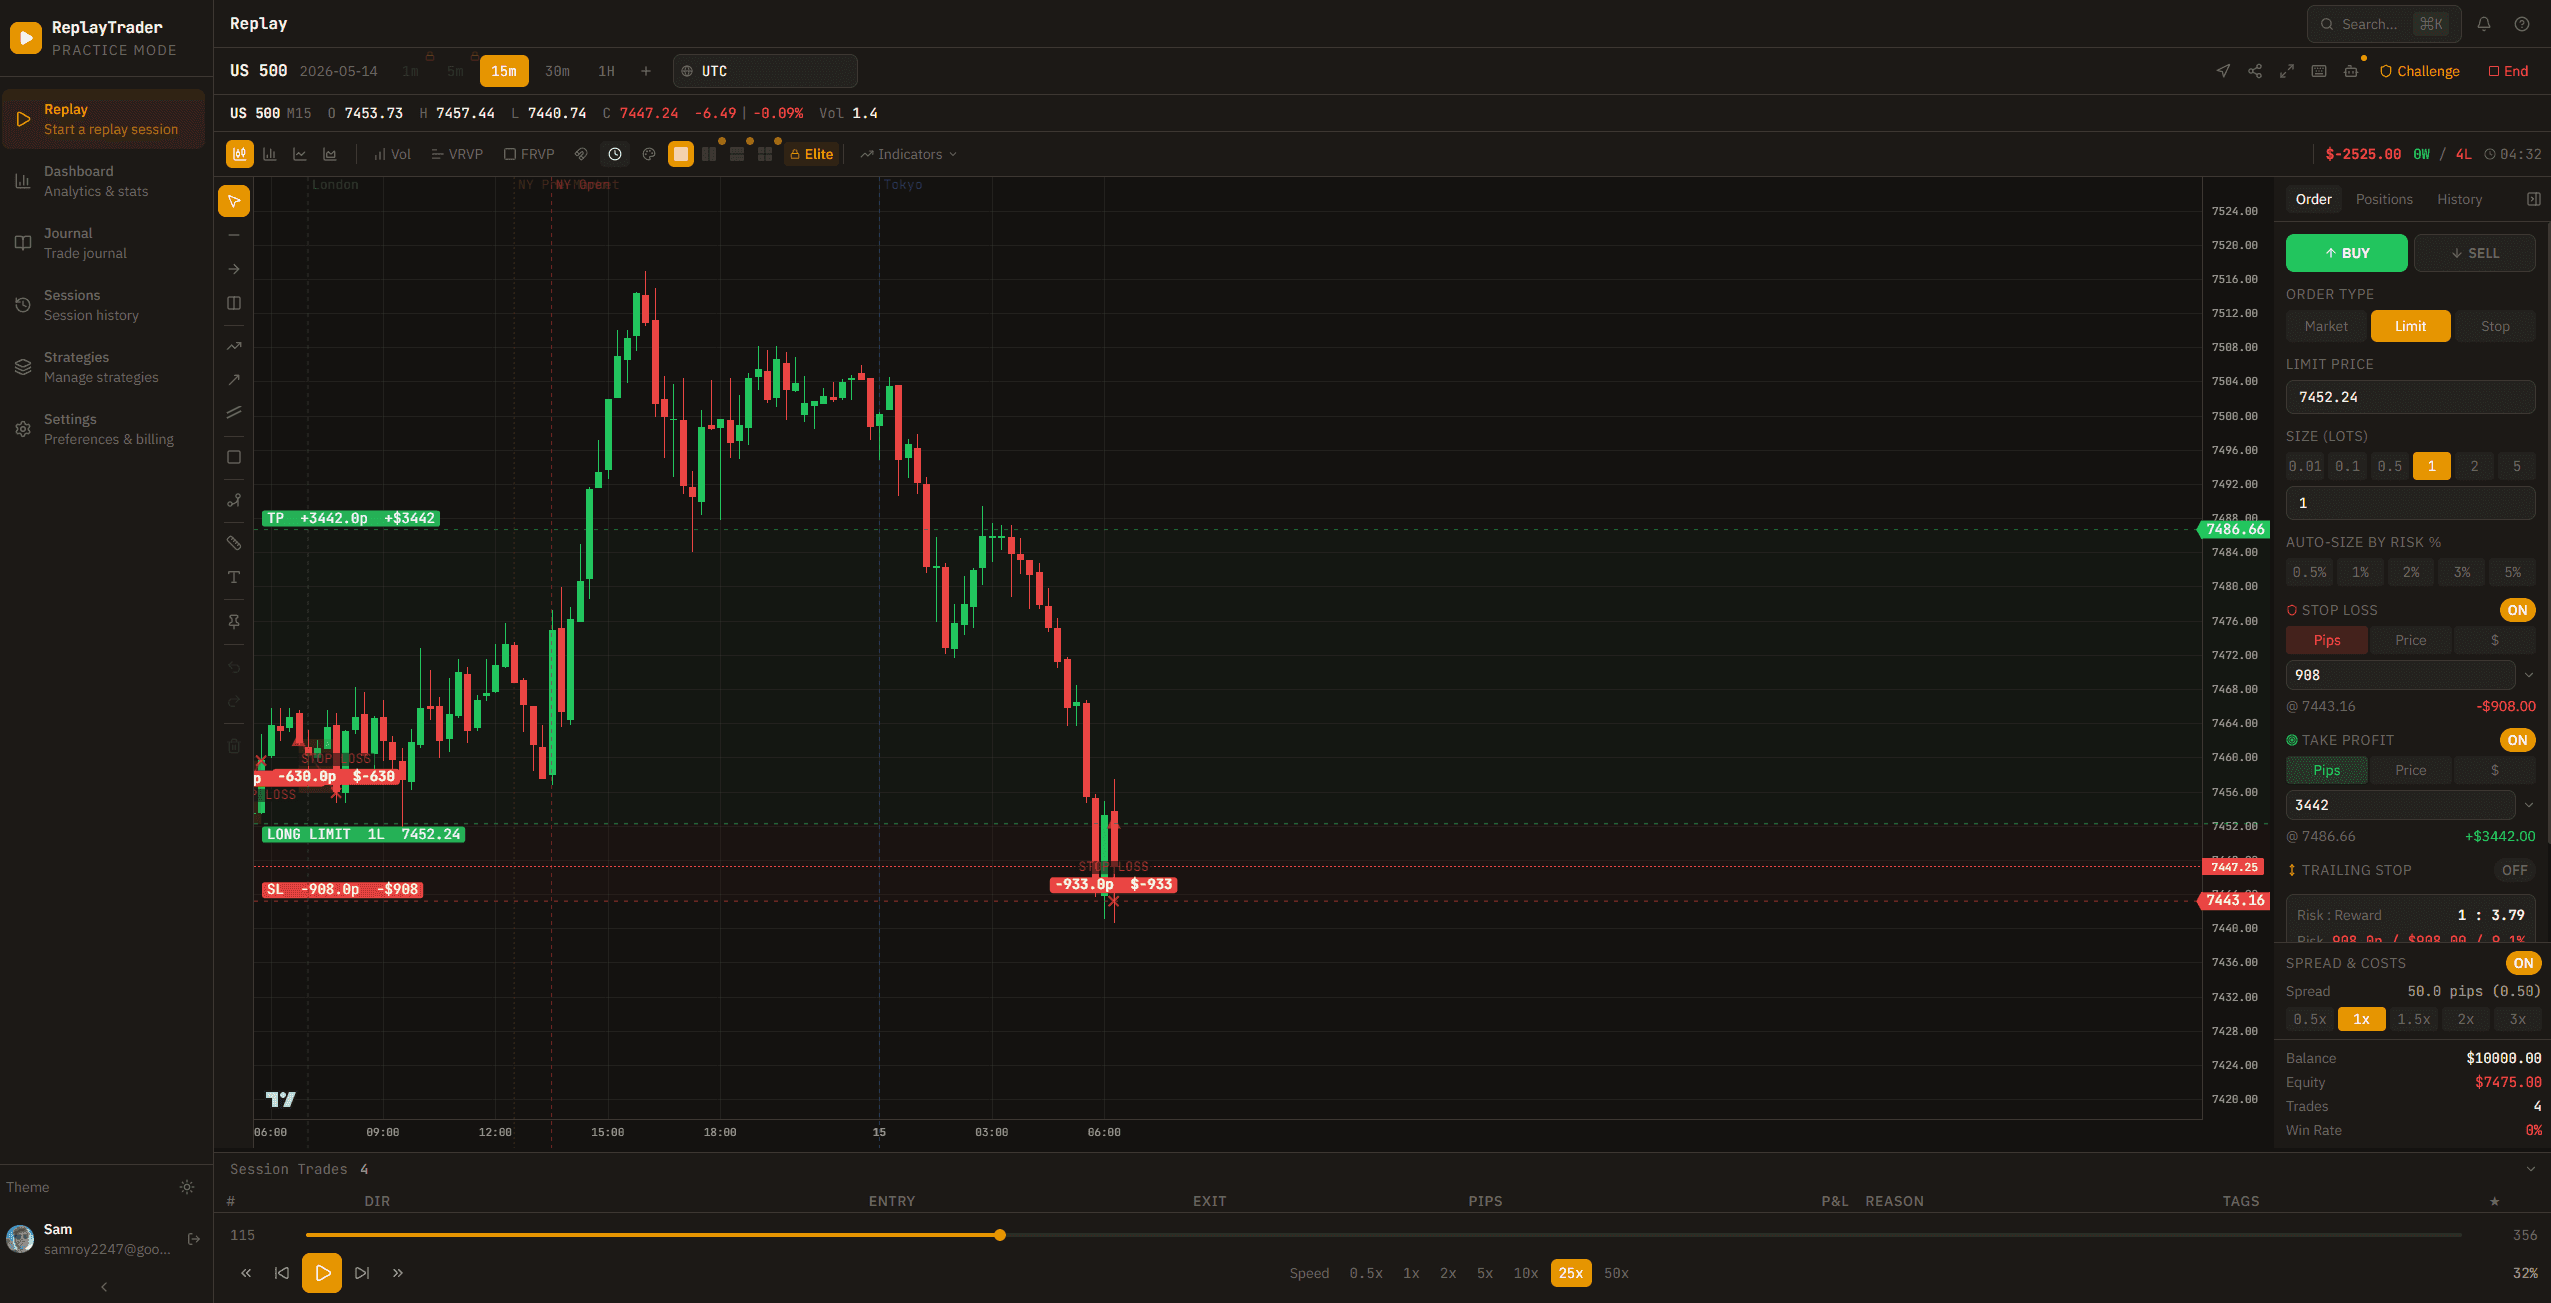
Replay and trading view: step through real price action and place simulated trades with live stop loss and take profit.
// tech stack
- Framework
- Next.js 16 (App Router, Server Components, Route Handlers)
- Language
- TypeScript (strict mode)
- UI
- React 19, Tailwind CSS v4, custom component system (no UI kit)
- Charts
- TradingView Lightweight Charts v5 (price), Recharts (analytics)
- State
- Zustand (client-side replay, trade, and UI stores)
- Database
- PostgreSQL on Neon (serverless driver)
- ORM
- Prisma 7 (driver-adapter pattern)
- Cache
- Upstash Redis
- Auth
- Clerk
- Payments
- Stripe (Checkout, Customer Portal, webhooks)
- Market data
- Dukascopy via dukascopy-node (free historical OHLC)
- Animation
- Framer Motion + bespoke effect components
- Icons / Fonts
- Lucide React, self-hosted Google Fonts via next/font
- Hosting
- Vercel
// architecture & engineering
Three-tier market-data pipeline
Candle requests cascade through Redis, then PostgreSQL, then Dukascopy, persisting and back-filling each layer on a miss. Hot data serves in milliseconds; cold data is fetched once and cached permanently. Cache keys are scoped per symbol/timeframe/day.
Client-side replay engine
All candles for a session load into the browser up front; the engine is a pointer that walks the array on a setInterval loop, advancing one candle per tick at the chosen speed. The chart updates incrementally (series.update) during playback and only re-renders fully (series.setData) on a rewind or seek, keeping playback smooth even at 50×.
Canvas overlay rendering
Drawings, trade markers, and volume profiles render on transparent canvas layers using pointer-events: none plus document-level capture-phase listeners. This lets the chart handle all native pan/zoom while custom graphics stay perfectly aligned to price/time coordinates on every frame via a requestAnimationFrame loop.
Custom timeframe aggregation
Beyond the standard intervals, users can define non-standard timeframes (e.g. 3m, 7m, 45m, 2h). The server picks the smallest Dukascopy-native base timeframe that divides cleanly and aggregates OHLCV into epoch-aligned buckets.
Volume profile from scratch
Fixed-range and visible-range volume profiles are computed by distributing each candle's volume proportionally across price bins, then deriving the Point of Control and the 70% value area, rendered as a horizontal bull/bear-split histogram with POC and VAH/VAL lines.
Subscription tiering with a single source of truth
All entitlement logic lives in one module and is enforced both server-side (API routes return 402 for out-of-tier requests) and client-side (locked UI with upgrade prompts), so gating can't be bypassed by hitting the API directly. Stripe webhooks keep the user's tier in sync with their subscription lifecycle.
Resilience & polish
Session state auto-saves to localStorage for crash recovery; the Stripe and database clients initialise lazily so the app boots cleanly even when an integration isn't configured; and the whole product is responsive down to a mobile trading terminal (off-canvas panels, slide-in trade sheet).
// notable problems solved
- Smooth candle-by-candle playback without re-rendering the entire chart each tick, via incremental updates plus a single full-redraw path for seeks.
- Pixel-accurate custom graphics over a third-party chart that pans and zooms independently, solved with a non-blocking canvas plus capture-phase event interception.
- Tamper-proof feature gating for a freemium model, by mirroring one entitlement module across server and client.
- Production hardening: migrated render-blocking web fonts to self-hosted next/font (eliminating layout shift), added SEO infrastructure (metadata, OG images, sitemap, robots), an accessibility pass (focus management, reduced-motion, ARIA), and full error/loading/empty states.
// scope & results
- 20+ instruments across forex, indices, commodities, and crypto, with up to ~20 years of historical data.
- 15 major feature areas delivered end-to-end, from the data layer to billing to marketing.
- Production Lighthouse: 94 Performance, 94 Accessibility, 100 Best Practices, 91 SEO, with CLS of 0.002.
- Complete go-live: custom domain, production auth, live payments, legal pages (disclaimer, privacy, terms), and a contact flow.
// selected features
Charting
Candlestick / bar / line / area chart types · volume histogram · SMA, EMA, VWAP, RSI, MACD, Bollinger Bands, ATR · 11 drawing tools (trendlines, channels, fibonacci, rectangles, measure, text, etc.) · magnet snap-to-OHLC · undo/redo · DST-aware session markers (Tokyo/London/NY) · timezone selector · screenshot export · fullscreen · keyboard shortcuts.
Trading
Market / limit / stop orders · SL/TP in pips, price, or dollars · trailing stops · risk-percentage auto-sizing · live R:R calculation · draggable entry/SL/TP lines on the chart · order preview · right-click / shift-click / ctrl-click order placement · spread + commission + slippage simulation · trade notifications with Web Audio sounds · MFE/MAE tracking.
Analytics & journal
Equity curve · drawdown analysis · trade distribution · time-of-day & day-of-week analysis · GitHub-style P&L calendar · strategy breakdown · Monte Carlo simulation · MFE/MAE & R:R risk metrics · filterable/sortable journal with tags, star ratings, and notes · CSV import/export.
Platform
Clerk authentication · Stripe subscriptions with Customer Portal · three-tier freemium gating · prop-firm challenge simulator · session playlists · URL-based replay sharing · multi-chart layouts · 7 colour themes plus a retro CRT mode · command palette (⌘K) · full marketing site · legal pages · contact form.